Documenting and sharing daily injury records within the Athlete RMS NHL platform with an upgrade report system.
2023

Impact:
23%
+57%
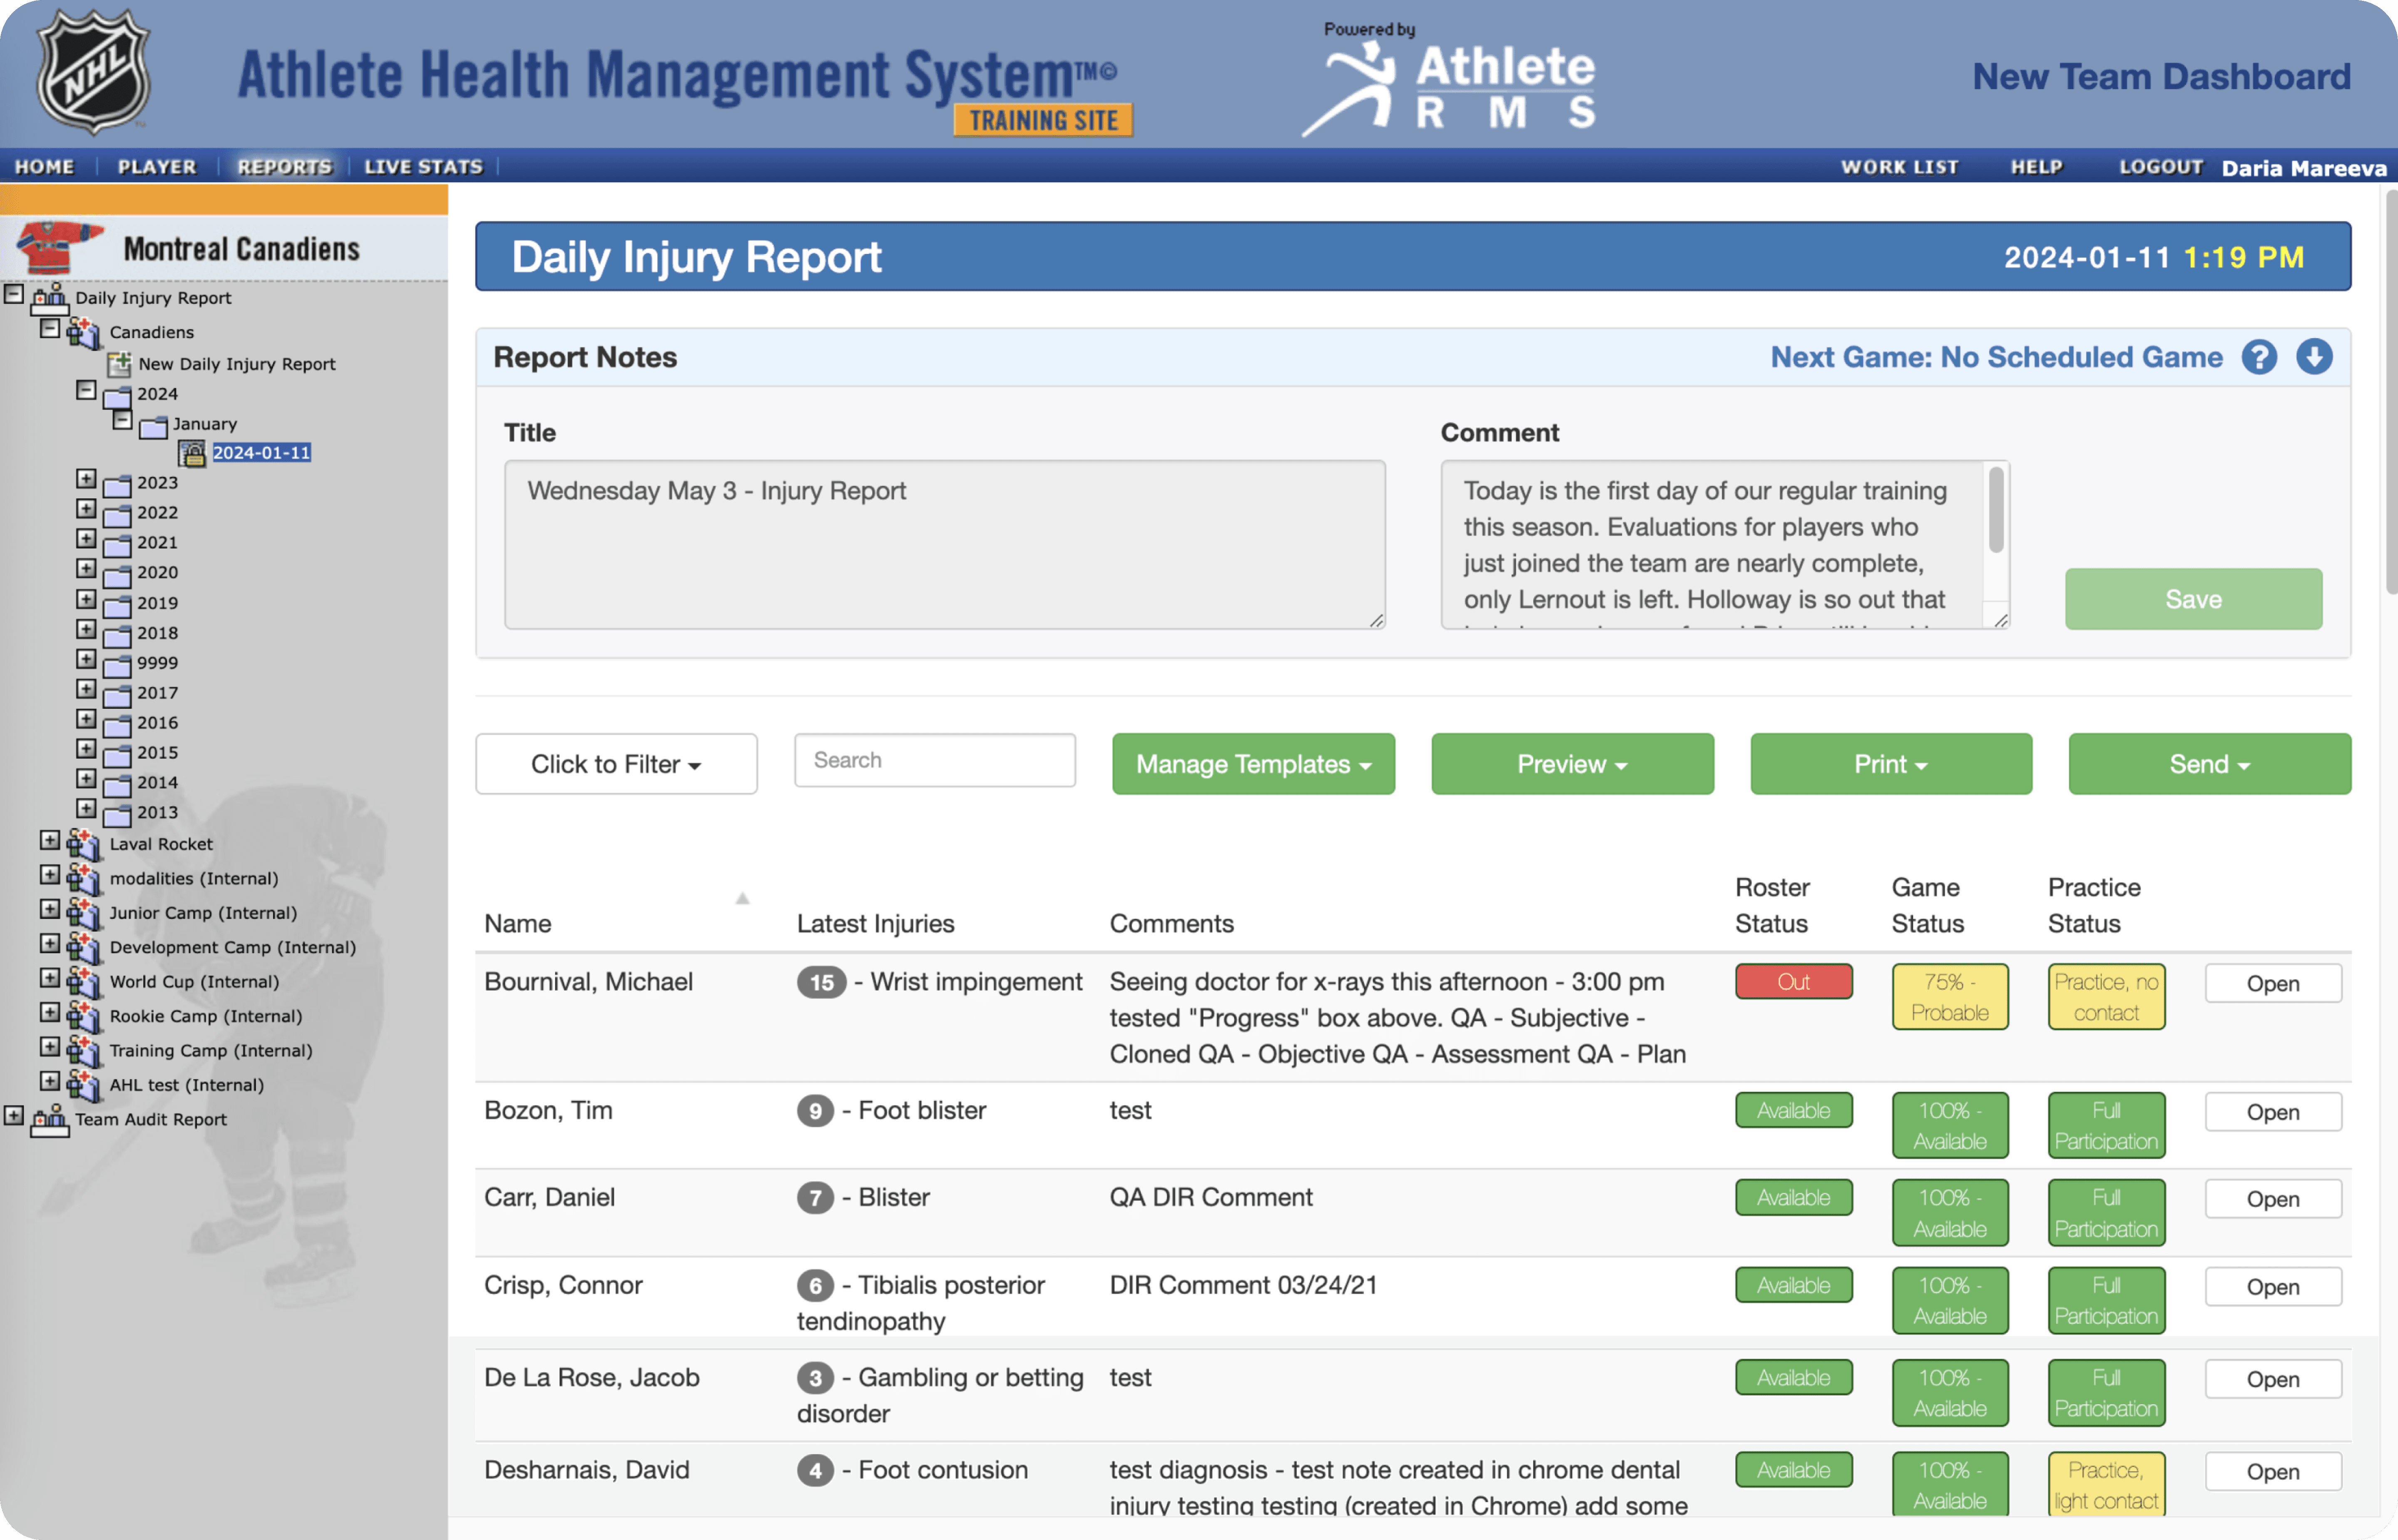
Legacy feature
Purpose: What do users need reports for?
Usage: How are reports used in daily workflows?
Audience: Who are the reports shared with or sent to?
Flexibility: How much do users need to modify or customize reports?
User Identification: Who are the users?
Workflows: What does day-to-day work look like for different user groups?
Needs Variation: How do the needs differ across user groups?
Usage Patterns: How is the legacy system used by current users?
Frequency: How often is it used?
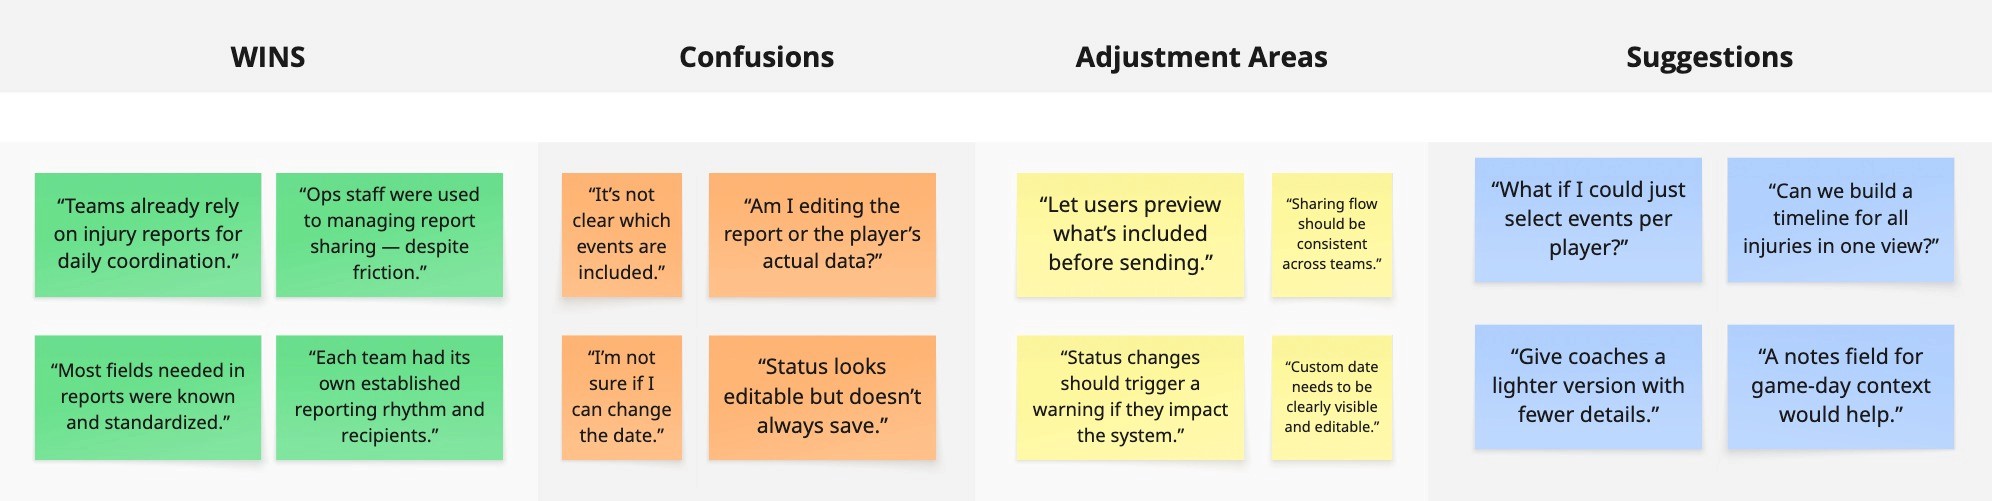
Friction Points: Where do users experience challenges or frustration?
Mental Models: What familiar patterns or expectations have users developed?
We integrated surveys into the existing user flow to learn about users’ main functional needs around reporting. This method helped us collect broad feedback at scale, with over 65 participants contributing valuable insights.
To capture usability insights across different user groups, we conducted three focused sessions with Coaches, Medical Staff, and Team Operations staff. Focus groups allowed us to explore different workflows and uncover how needs varied across roles.
We ran unmoderated usability tests on the outdated legacy reports flow, combined with targeted user interviews. This helped us understand users’ thought processes, priorities, friction points, and goals when creating and sharing reports.